Market Overview
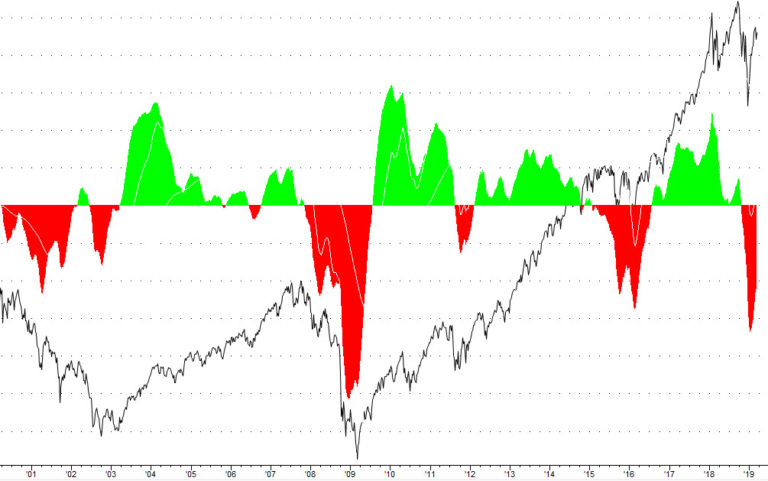
BULL BEAR Oscillator Positive!!!! There are changes in all the models. The changes have been highlighted in yellow.
Stronger signals, even stronger noise
In 2015, IBM signaled that 90% of all the data in the world had been created in the previous two years. While there aren’t stats for what that figure is today, surely it’s higher. At last read, one minute is all it takes for the digital world to produce 3.8 million Google searches, 448,800 tweets and 500 hours of YouTube videos.
Clearly, we are awash with data and need to parse out what we need from what we get. That goes for just about every human endeavor, but is particularly true when it comes to our personal finances.
In this space, we’ll parse out what it’s important to know from what is nice to know from what ought to be left to those who have all day to dwell on it. Let’s make sure we keep our heads above the deluge.
The basics
Traditionally, there were three major drivers of a financial security’s value: fundamental value, analyst sentiment and earnings quality. These three concepts are interrelated but distinct. We’ll start with fundamental value, which is the prime determinant of what a stock should be worth.
Fundamental value takes the issuing company’s expected earnings over the foreseeable future then figures out how much it’s worth in terms of cash in the bank today. You then divide that amount by the number of shares outstanding. This gives you the price per share.

Open outcry trading, as it was practiced on the floor of the New York Stock Exchange in 1963. We don’t do it this way anymore.
But fundamental analysis is really just the first cut of what an equity share is worth. Remember, that one share has to compete with shares of other stocks, bonds and more complicated securities. That’s why banks and investment firms hire analysts who help make predictions about how much a company is likely to earn. They also – and this is really important – determine how risky investing in this company might be. The trick is to get the highest reward for the least risk. Based on all this, analyst sentiment produces recommendations to buy, sell or hold a security.
One thing that factors highly into an analyst’s sentiment is earnings quality. Corporate accounting is loaded with non-cash events that can make earnings look stronger than they really are. If OverSimpliCorp prefers to expense everything it buys in the year it buys it, it’s going to have very high costs compared to its revenues. But suppose its rival, the Shennanigan Group, has exactly the same revenues but chooses to depreciate everything more expensive than pens and paper clips, it won’t fully recognize the cost of its Keurig machine for another 10 years. Shennanigan Group’s income statement is going to suggest higher earnings than OverSimpliCorp, even though that’s not the underlying economic truth. It’s the analyst’s job to spot such distortions.
That’s just one kind of earnings shell game. There’s a slew of others that effect earnings quality.
The advanced stuff
We occupy a unique place in history that, if 40 years of punditry is correct, will be remembered as the Information Age. You’ve no doubt heard the expression “big data.” It’s very much a factor in financial services today – perhaps more in this sector than any other.
Some of this data can be used to directly supplement fundamental value. Companies are using machine learning to create an artificial intelligence application that drive down costs and open up new markets. Netflix has a good idea of what you want to watch next, giving you a better user experience. Your bank might have a chatbot that can answer questions about your online transactions. This is convenient for you and also reduces payroll for the bank.
Meanwhile, natural language processing (NLP) can find clues in what’s being said by experts about stocks. Thanks to this AI-oriented discipline, data scientists can actually quantify how favorable or unfavorable analyst sentiment is. By mining not only what analysts are saying in their research briefs, but actually parsing their questions on conference calls with corporate management, NLP can triangulate on how likely an analyst might be to update an opinion.
Big data is also being brought to bear in new ways that go beyond fundamental value, analyst sentiment or earnings quality. By finding clues in internet searches, geolocation and social media, ubiquitous computing is learning how to anticipate consumer behavior. If we know what people are about to buy, then we can figure out which companies deserve our investment dollars.
Back to basics
All this machine learning and big data informs the analysts but, ultimately, it just allows them to do their jobs better and provide that human judgment.
That last part is critical. There’s a big difference between hard-science applications of these oceans of data and those of soft, squishy social sciences such as economics. Individual discernment will remain a key element for generations to come.
That’s not to say there aren’t points of information that are worth knowing if you’re interested in taking an active and informed role in your investments. But the most important of these – the ones that tell you whether we’re heading for boom years or bust, haven’t changed in decades and they don’t need to now. They’re called economic indicators and there are three types, according to the Conference Board, a hundred-year-old think tank that is the arbiter of such things.
Leading indicators tell you where the economy is heading. The most obvious of these is the S&P 500. That is, stock prices tell us if investors think profits will rise in the near future, not where they are right now. There are nine other leading economic indicators, including initial claims for unemployment insurance, new factory orders and the interest spread between the 10-year Treasury bond and the Fed Funds rate.
Coincident indicators attempt to monitor changes that are currently happening in the economy. The oft-cited gross domestic product is widely considered coincident. After all, the definition of a recession is two or more quarters in a row with negative GDP. Still, the Conference Board doesn’t take it into account, focusing instead on jobs growth, industrial production and other factors.
Lagging indicators might sound like a contradiction in terms, but they serve as confirmation that the leading and coincident indicators were right. These are often measures of unemployment duration, consumer credit, value of outstanding loans and business inventories. In other words, we’ll know we’re in a recession when people lose their jobs, credit cards get run up, banks can’t collect what they’re owed and stores can’t sell what they’ve already ordered.
You might notice that we’ve been including many of these indicators in our monthly Market Overview. We’ll continue to do that and consider which ones we ought to add to our usual discussion.
There is a lot of noise right now. Maybe that’s why we have such a different investment environment today than we had a mere three months ago, even though very little has changed in the broader economy. In the moment, it can be difficult to tell direction from diversion, which is why we keep hammering home the virtues of having a disciplined investing strategy.
This is, of course, easier in theory than in practice. You might be well served to consult a financial professional before making any major investment decisions.


